33.0 µmol/L. That’s the average whole-blood NAD+ level across 1,518 adults in a 2022 community study.
It’s a handy benchmark. It’s also only useful if your test measured the same thing, in the same kind of sample, the same way. Here’s what a NAD test actually measures, what the studies call normal, and how to read a number once you have one.
What a NAD Test Measures
NAD+ (nicotinamide adenine dinucleotide) is a coenzyme your cells use to move electrons around during metabolism. It’s also the fuel that two families of enzymes burn through: PARPs, which help repair DNA, and sirtuins. A NAD test puts a number on how much of it is in a sample. Two things decide what that number means: which sample went in, and which method read it.
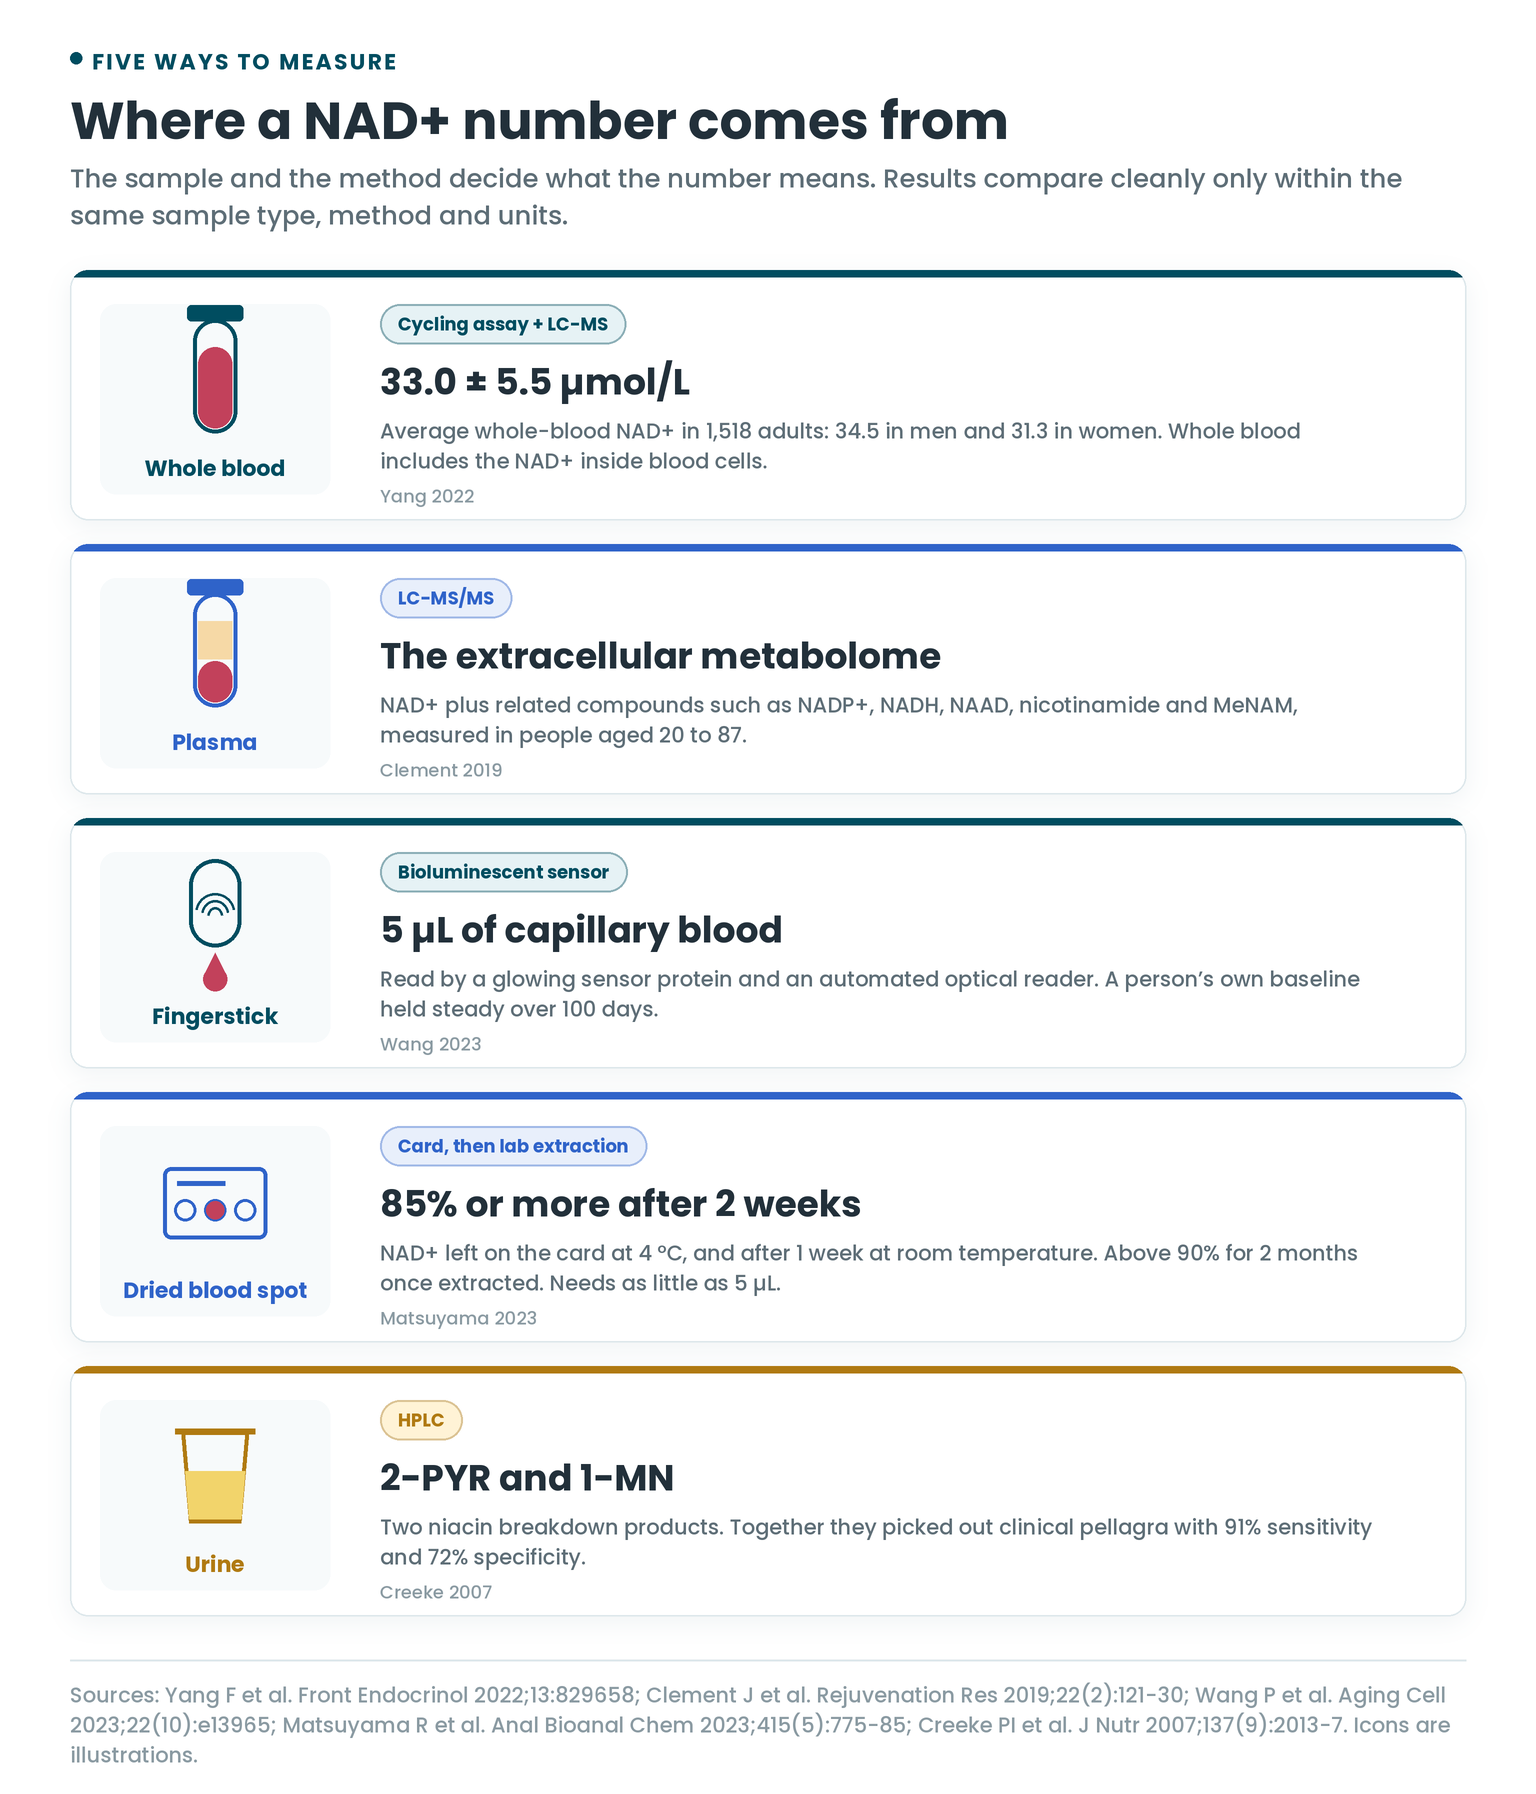
Whole Blood, Plasma or Urine
- Whole blood includes the blood cells, so it captures the NAD+ inside them. It’s what the 1,518-adult study and both small-sample methods below measured.
- Plasma is the liquid part of blood with the cells spun out. A 2019 study called what it holds the “extracellular” NAD+ metabolome: NAD+ plus a whole family of related compounds.
- Urine tests usually measure what NAD+ and niacin break down into, not NAD+ itself. That’s the sample of choice for niacin status (more on that below).
How Labs Measure It
- LC-MS/MS (liquid chromatography with tandem mass spectrometry). Separates the compounds, then identifies each by its mass. The 2019 plasma study used it to measure NAD+ alongside a range of related compounds.
- Enzymatic cycling assay. Uses enzymes that cycle NAD+ over and over to amplify a signal. The large whole-blood study used a cycling assay alongside LC-MS.
- Fingerstick sensor. A 2023 method reads 5 µL of capillary blood with a glowing (bioluminescent) sensor protein and an automated optical reader.
- Dried blood spot. A drop of blood dries on a collection card, which holds it until the lab extracts it. Another 2023 method needs as little as 5 µL, and its authors note it can be collected at a clinic or at home.
Why Handling Matters
NAD+ and its precursors are unstable in blood and hard to measure, which the dried-blood-spot team gives as the reason so few studies have linked blood NAD+ to aging or disease. Drying the sample fixes a lot of that. On the card, NAD+ held at 85% or more of its starting level for at least 2 weeks at 4 °C (fridge temperature) and for 1 week at room temperature. Once extracted into the lab’s solution, it stayed above 90% for 2 months.
So a sample that sat around before it was processed can read low for reasons that have nothing to do with you.
What’s a Normal NAD+ Level?
The reference numbers here come from a 2022 study of 1,518 adults, free of cardiovascular disease and cancer, with an average age of 43 and slightly more men than women (52.6%). Whole-blood NAD+ was measured by cycling assay and LC-MS:
| Group | Average whole-blood NAD+ |
|---|---|
| Everyone | 33.0 ± 5.5 µmol/L |
| Men | 34.5 µmol/L |
| Women | 31.3 µmol/L |
That’s 3.2 µmol/L lower in women, or about 9% below the men’s average (my arithmetic, not the paper’s). One diet difference turned up too: how much meat people ate differed across the four NAD+ quartiles.
The 2023 fingerstick study found the same pattern in the real world: men averaged higher NAD+ than women before age 50. It found two more things worth knowing. Aerobic exercise and NMN supplements went with higher whole-blood NAD+, and a person’s own baseline stayed stable over 100 days.
Does NAD+ Fall With Age?
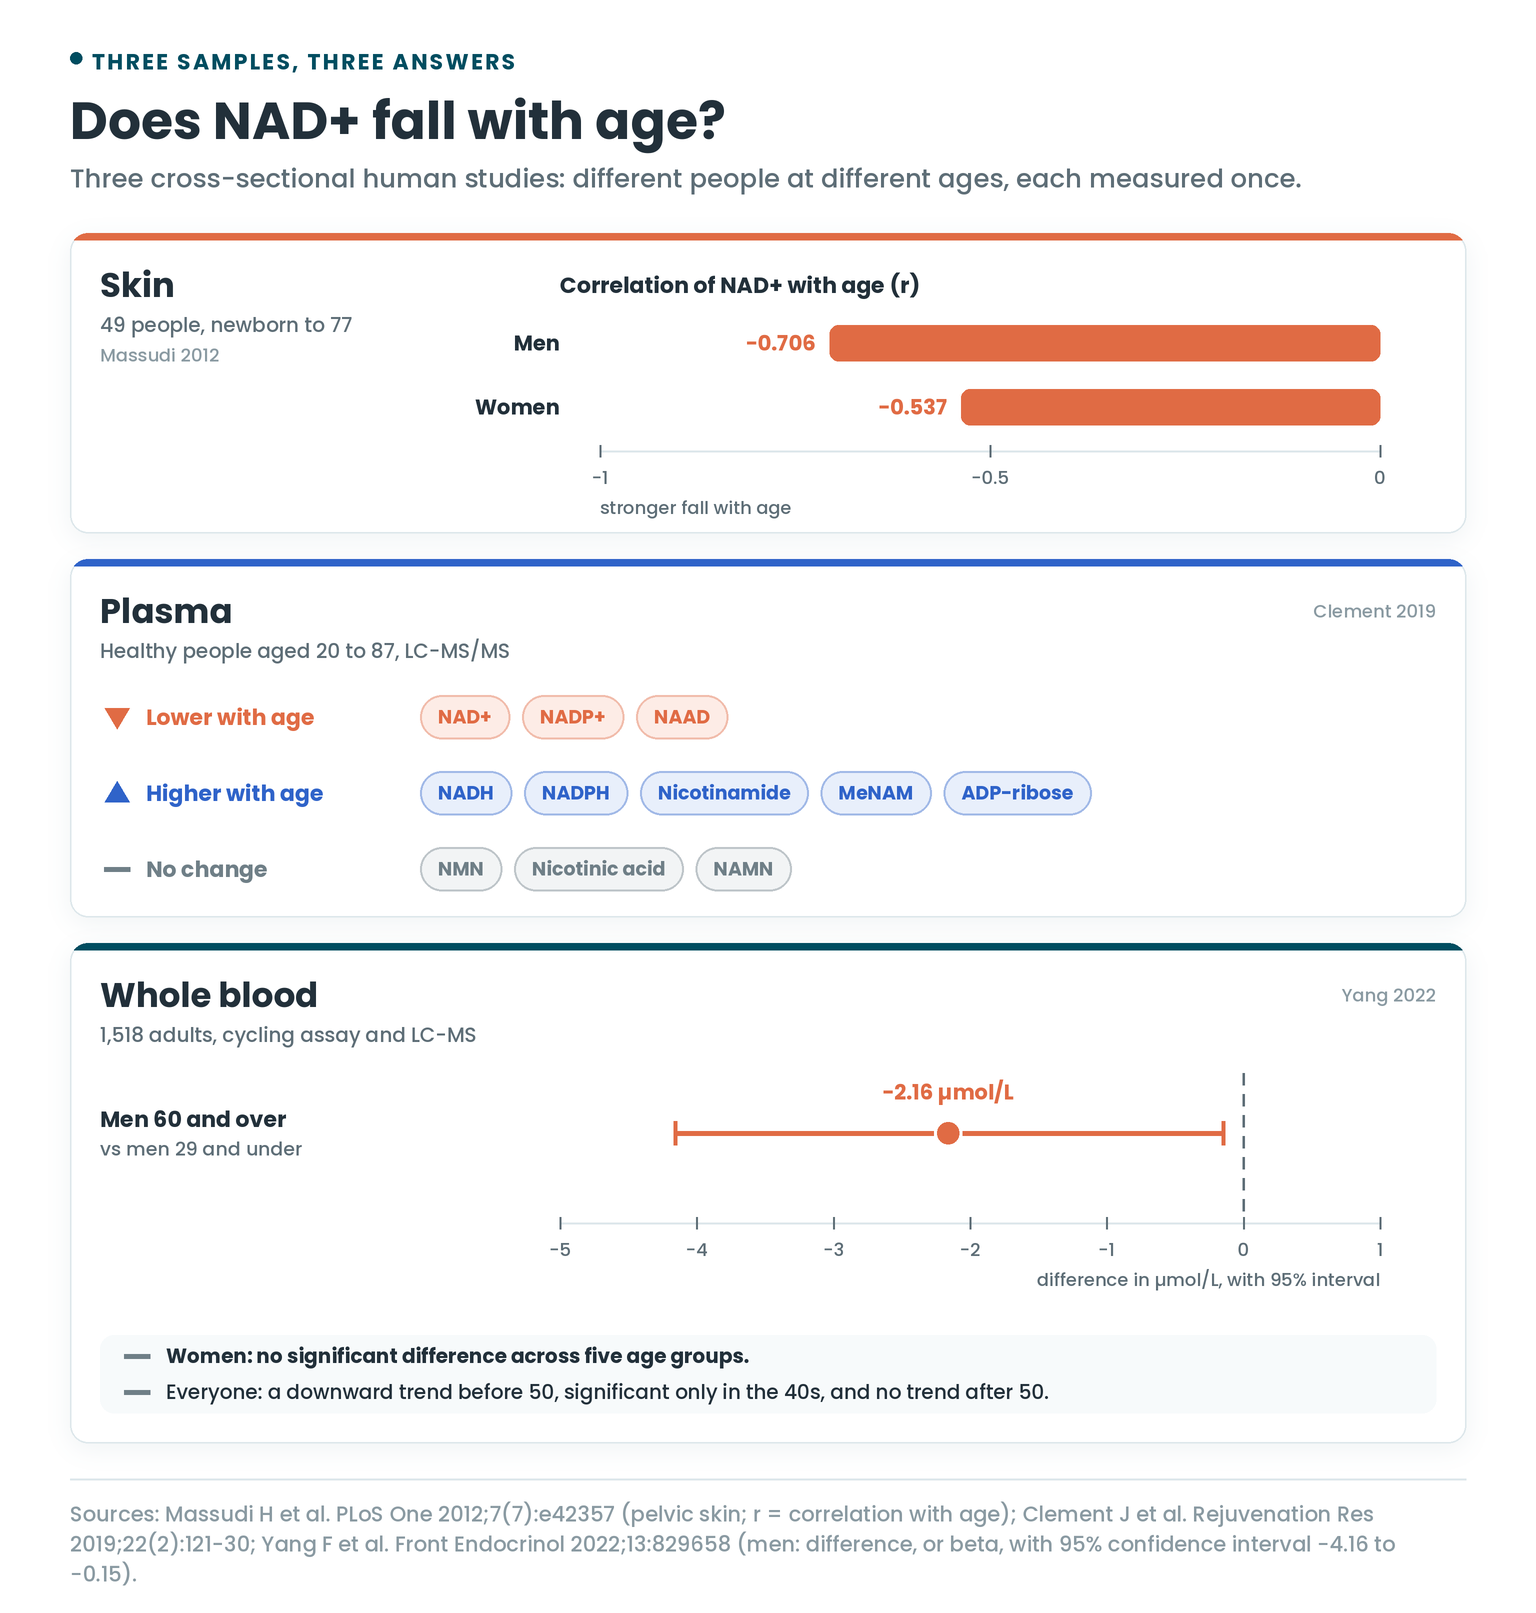
It depends on where you look. Three human studies, three samples, three answers.
Skin
In skin samples from 49 people aged from newborn to 77, NAD+ fell steadily with age. The correlation was strong in men (r = −0.706) and in women (r = −0.537). DNA damage rose with age in both. PARP activity climbed with age in men (r = 0.768), and higher PARP activity went with lower NAD+ (r = −0.639).
The authors’ explanation: oxidative DNA damage builds up with age, PARPs work overtime to repair it, and they burn through NAD+ while doing it.
Plasma
In plasma from healthy people aged 20 to 87, the 2019 LC-MS/MS study found the metabolome shifting in both directions:
- Lower with age: NAD+, NADP+ and NAAD.
- Higher with age: NADH, NADPH, nicotinamide (NAM), N-methyl-nicotinamide (MeNAM) and ADP-ribose (ADPR).
- No change: NMN, nicotinic acid and NAMN.
MeNAM is made from nicotinamide by an enzyme called NNMT. For a molecule that blocks that enzyme, see 5-Amino-1MQ Side Effects.
Whole Blood
In the 1,518-adult study, NAD+ trended down before 50, but the drop was only significant for people in their 40s, and the trend disappeared after 50. Split by sex, the picture got sharper:
- Men: lower with age, significantly so only at 60 and over compared with 29 and under, by 2.16 µmol/L. That’s about 6.5% of the 33.0 average (again, my arithmetic).
- Women: no significant difference across the five age groups.
The authors’ summary: the loss of whole-blood NAD+ with age showed up in men only, especially middle-aged men. All three studies were cross-sectional: different people at different ages, each measured once.
What Moves the Number
Supplements
Every precursor trial here that measured blood NAD+ saw it rise:
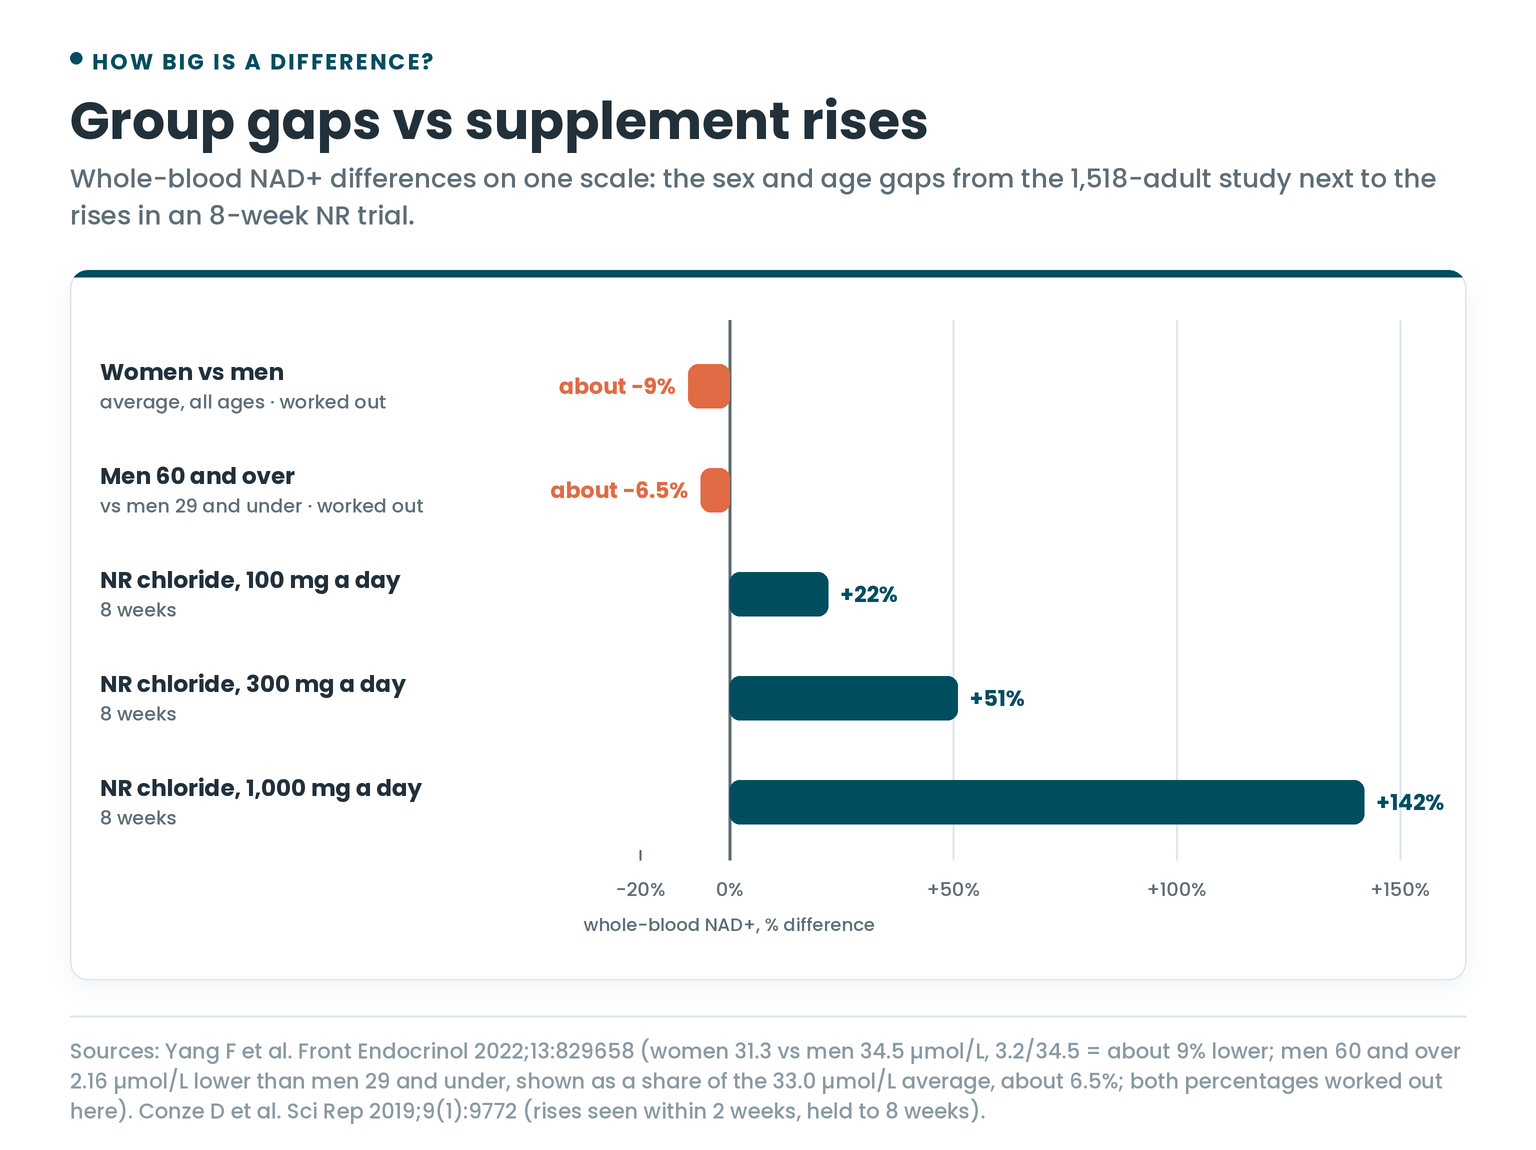
- NR (nicotinamide riboside) chloride: 100, 300 and 1,000 mg a day raised whole-blood NAD+ by 22%, 51% and 142% in overweight but otherwise healthy adults. The rises showed up within 2 weeks and held for the full 8 weeks.
- NR, single doses: 100, 300 and 1,000 mg raised blood NAD+ in step with the dose. In a one-person pilot within the same paper, blood NAD+ rose as much as 2.7-fold.
- NMN (nicotinamide mononucleotide): 250 mg a day for 6 or 12 weeks raised whole-blood NAD+ in older men, and 300, 600 or 900 mg a day for 60 days raised blood NAD+ in healthy middle-aged adults.
- NMN as MIB-626: 1,000 mg once or twice a day for 14 days raised circulating NAD+ in step with the dose, measured by LC-MS/MS.
For how the forms compare and what to check on a label, see Best NAD+ Supplements. For the mouse research behind NMN, see David Sinclair’s NMN.
Exercise
In the fingerstick study, aerobic sport went with higher whole-blood NAD+. If you’re comparing two readings, that’s a reason to keep your training steady between them.
IV Drips
In a pilot study, NAD+ was infused at 3 µmol per minute for 6 hours. For the first 2 hours, plasma NAD+ didn’t budge. The authors concluded it was being cleared from the blood quickly and completely. By 6 hours, NAD+ and MeNAM were turning up in the urine.
NAAD and Breakdown Products
Some tests report more than NAD+. Two of the extras have human data behind them:
- NAAD rose with NR in a 2016 human study, which identified it as a highly sensitive marker of NAD+ being topped up.
- 2-PY and 4-PY, two breakdown products of nicotinamide, rose in plasma in step with single NMN doses of 100, 250 and 500 mg.
Urine Tests and Niacin Status
For niacin (vitamin B3) status, urine is the better sample. A study in central Angola compared 34 people with clinical pellagra, the classic niacin deficiency disease, against 107 women from the same community with no signs of it. Whole-blood NAD and NADP weren’t significantly lower in the pellagra patients. Two urine breakdown products were:
- 2-PYR (the same compound as 2-PY above) and 1-MN (the same compound as MeNAM) were lower in pellagra and rose markedly after treatment.
- Used together, with cut-offs of 3.0 and 1.3 µmol per mmol of creatinine, they picked out pellagra with 91% sensitivity and 72% specificity.
In the study’s two healthy volunteers, blood NAD varied much less from day to day than the urine markers did. So blood was the steadier number, and urine was the one that picked up deficiency.
How to Read Your Result
Compare Like With Like
A number only compares cleanly with another number from the same sample type, the same method and the same units. Whole-blood NAD+ in µmol/L (the same as µM) lines up with the averages above. A plasma result, a urine metabolite or a result in different units needs its own reference range from the lab that ran it.
Place Your Reading
Enter a whole-blood NAD+ reading to see where it sits against the 1,518-adult averages. Then enter a before and after reading to see how big the change is next to the differences the studies found.
How Big Is a Change?
Women averaged about 9% below men, and men 60 and over sat about 6.5% below the youngest men. NR moved whole-blood NAD+ by 22% to 142%.
So a change of a few percent between two tests is the size of a whole age gap, while the supplement trials moved the number several times further. With a personal baseline that held steady over 100 days, a repeat test on the same method is the cleanest way to see your own change.
Timing a Retest
On NR, the rise showed up within 2 weeks and held through 8 weeks. If you’re checking the effect of a change, I’d retest at least 2 weeks in, on the same method, with exercise and diet kept steady.
Doses Used in the Research
- NR chloride, overweight adults: 100, 300 or 1,000 mg a day for 8 weeks (Conze 2019).
- NR, single doses: 100, 300 and 1,000 mg (Trammell 2016).
- NMN, older men: 250 mg a day for 6 or 12 weeks (Igarashi 2022).
- NMN, middle-aged adults: 300, 600 or 900 mg a day for 60 days (Yi 2023).
- NMN as MIB-626, adults aged 55 to 80: 1,000 mg once or twice a day for 14 days (Pencina 2023).
- NMN, single doses: 100, 250 and 500 mg (Irie 2020).
- NAD+ by IV: 3 µmol per minute for 6 hours (Grant 2019).
Frequently Asked Questions
What is a normal NAD+ level?
In 1,518 adults, average whole-blood NAD+ was 33.0 ± 5.5 µmol/L: 34.5 in men and 31.3 in women. That applies to whole-blood tests reported in µmol/L.
Does NAD+ go down with age?
In skin, yes, in men and women. In plasma, NAD+, NADP+ and NAAD were lower with age. In whole blood, the drop showed up in men only, mainly in middle age and beyond.
How much blood does a NAD test need?
Both 2023 small-sample methods, the bioluminescent fingerstick sensor and the dried blood spot, work with as little as 5 µL of blood.
Can I compare a plasma result with a whole-blood result?
Compare results from the same sample type, method and units. Plasma measures the NAD+ outside cells, while whole blood includes the NAD+ inside blood cells.
How fast does NAD+ rise on NR?
In an 8-week trial, whole-blood NAD+ rose within 2 weeks on 100, 300 and 1,000 mg a day and held for the rest of the trial.
What’s the best test for niacin deficiency?
Spot urine 2-PYR and 1-MN. Together they picked out clinical pellagra with 91% sensitivity and 72% specificity in a study in Angola.
Do men have higher NAD+ than women?
On average, yes. In the 1,518-adult study men averaged 34.5 µmol/L and women 31.3, and the fingerstick study found men higher before age 50.
Stay sharp,
Joe Mars
The Peptide Report
P.S. Got a NAD+ result you’re trying to make sense of? Bring it to the Peptides & Biohacking Hub on Skool.
References
- Yang F, Deng X, Yu Y, et al. Association of human whole blood NAD+ contents with aging. Front Endocrinol (Lausanne). 2022;13:829658. doi:10.3389/fendo.2022.829658
- Clement J, Wong M, Poljak A, Sachdev P, Braidy N. The plasma NAD+ metabolome is dysregulated in “normal” aging. Rejuvenation Res. 2019;22(2):121-130. doi:10.1089/rej.2018.2077
- Wang P, Chen M, Hou Y, et al. Fingerstick blood assay maps real-world NAD+ disparity across gender and age. Aging Cell. 2023;22(10):e13965. doi:10.1111/acel.13965
- Matsuyama R, Omata T, Kageyama M, et al. Stabilization and quantitative measurement of nicotinamide adenine dinucleotide in human whole blood using dried blood spot sampling. Anal Bioanal Chem. 2023;415(5):775-785. doi:10.1007/s00216-022-04469-7
- Massudi H, Grant R, Braidy N, et al. Age-associated changes in oxidative stress and NAD+ metabolism in human tissue. PLoS One. 2012;7(7):e42357. doi:10.1371/journal.pone.0042357
- Conze D, Brenner C, Kruger CL. Safety and metabolism of long-term administration of NIAGEN (nicotinamide riboside chloride) in a randomized, double-blind, placebo-controlled clinical trial of healthy overweight adults. Sci Rep. 2019;9(1):9772. doi:10.1038/s41598-019-46120-z
- Trammell SAJ, Schmidt MS, Weidemann BJ, et al. Nicotinamide riboside is uniquely and orally bioavailable in mice and humans. Nat Commun. 2016;7:12948. doi:10.1038/ncomms12948
- Igarashi M, Nakagawa-Nagahama Y, Miura M, et al. Chronic nicotinamide mononucleotide supplementation elevates blood nicotinamide adenine dinucleotide levels and alters muscle function in healthy older men. NPJ Aging. 2022;8(1):5. doi:10.1038/s41514-022-00084-z
- Yi L, Maier AB, Tao R, et al. The efficacy and safety of β-nicotinamide mononucleotide (NMN) supplementation in healthy middle-aged adults: a randomized, multicenter, double-blind, placebo-controlled, parallel-group, dose-dependent clinical trial. GeroScience. 2023;45(1):29-43. doi:10.1007/s11357-022-00705-1
- Pencina KM, Lavu S, Dos Santos M, et al. MIB-626, an oral formulation of a microcrystalline unique polymorph of β-nicotinamide mononucleotide, increases circulating nicotinamide adenine dinucleotide and its metabolome in middle-aged and older adults. J Gerontol A Biol Sci Med Sci. 2023;78(1):90-96. doi:10.1093/gerona/glac049
- Irie J, Inagaki E, Fujita M, et al. Effect of oral administration of nicotinamide mononucleotide on clinical parameters and nicotinamide metabolite levels in healthy Japanese men. Endocr J. 2020;67(2):153-160. doi:10.1507/endocrj.EJ19-0313
- Grant R, Berg J, Mestayer R, et al. A pilot study investigating changes in the human plasma and urine NAD+ metabolome during a 6 hour intravenous infusion of NAD+. Front Aging Neurosci. 2019;11:257. doi:10.3389/fnagi.2019.00257
- Creeke PI, Dibari F, Cheung E, et al. Whole blood NAD and NADP concentrations are not depressed in subjects with clinical pellagra. J Nutr. 2007;137(9):2013-2017. doi:10.1093/jn/137.9.2013